Week six
Not Shocking People
1. You will use the OPAMP in “open-loop” configuration in this part, where input signals will be applied directly to the pins 2 and a. Apply 0 V to the inverting input. Sweep the non-inverting input (Vin) from -5 V to 5 V with 1 V steps. Take more steps around 0 V (both positive and negative). Create a table for Vin and Vout. Plot the data (Vout vs Vin). Discuss your results. What would be the ideal plot?

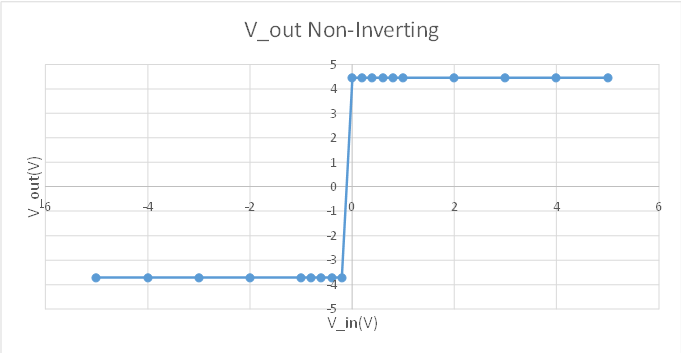
Figures 1 & 2: Values and graph for the voltage output of the non-inverting OPOMP. Values stay consistently at -3.72 while the voltage is below zero, and then stay at 4.46 V once the sign is switched after zero. With this open loop configuration, there are no resistors to limit the amplifier, so the gain is very large, therefor making the maximum values be reached very quickly. We only applied +/- 5 V, so the V_out cannot exceed +/- 5V. We seemed to have generated the ideal graph, with there being a sudden but recognizable slope in between the values of which the sign changes, representing the fact that the voltage cannot be changed instantaneously.
b. Apply 0 V to the non-inverting input. Sweep the inverting input (Vin) from -5 V to 5 V with 1 V steps. Take more steps around 0 V (both positive and negative). Create a table for Vin and Vout. Plot the data (Vout vs Vin). Discuss your results. What would be the ideal plot?
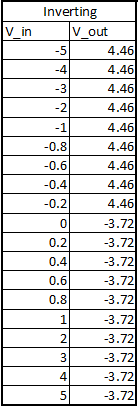

Figure 3 & 4: Values and graph for the voltage output of the inverting OPAMP. We found identical values, but on opposite signs of the V_in. This is due to the fact that the inverting OPAMP, as it is named, inverts the sign of the output. This is also an example of an ideal graph for the same reason as figure 4.
2. Create a non-inverting amplifier. (R2 = 2 kΩ, R1 = 1 kΩ). Sweep Vin from -5 V to 5 V with 1 V steps. Create a table for Vin and Vout. Plot the measured and calculated data together.


Figure 5 & 6: Measured and calculated data of the Non-Inverting Amplifier
3. Create an inverting amplifier. (Rf = 2 kΩ, Rin = 1 kΩ). Sweep Vin from -5 V to 5 V with 1 V steps. Create a table for Vin and Vout. Plot the measured and calculated data together.


Figure 7 & 8: Measured and calculated data of the Inverting Amplifier
4. Explain how an OPAMP works. How come is the gain of the OPAMP in the open loop configuration too high but inverting/non-inverting amplifier configurations provide such a small gain?
The OPAMP amplifies an input voltage to become a larger one. When using a non-inverting OPAMP, the amplified output voltage will have the same sign as the input voltage. When using an inverting OPAMP, the amplified output voltage will have the opposite sign of the input voltage.
With an inverting/non-inverting amplifiers, the gain is determined by the ratio of the resistors and multiplied by the input voltage to generate the output. However, with the open loop configuration, there are no resistors to limit the effect of the amplifier so the highest and lowest possible voltages can be reached very quickly.
With an inverting/non-inverting amplifiers, the gain is determined by the ratio of the resistors and multiplied by the input voltage to generate the output. However, with the open loop configuration, there are no resistors to limit the effect of the amplifier so the highest and lowest possible voltages can be reached very quickly.
Relay
1. Connect your DC power supply to pin 2 and ground pin 5. Set your power supply to 0V. Switch your multimeter to measure the resistance mode; use your multimeter to measure the resistance between pin 4 and pin 1. Do the same measurement between pin 3 and pin
1. Explain your findings (EXPLAIN).
When we measured between pins 1 and 4, we found the resistance to be .5 Ohms. When we measured between pins 1 and 3 we read the resistance to be 0L, meaning that it could not be read. This is because the switch inside the relay between 3 and 4 must have been connected to 4, therefor allowing a resistance to be read. Pin 3 was not connected to 1, therefor not allowing a proper resistance to be measured.
2. Now sweep your DC power supply from 0V to 8V and back to 0V. What do you observe at the multimeter (resistance measurements similar to #1)? Did you hear a clicking sound? How many times? What is the “threshold voltage values” that cause the “switching?”
Figure 9: Observations of the relay video with explanations.
3. How does the relay work? Apply a separate DC voltage of 5 V to pin 1. Check the voltage value of pin 3 and pin 4 (each with respect to ground) while switching the relay (EXPLAIN with a VIDEO).
Figure 10: Explanations and found values of the relay circuit video.
LED + Relay
1. Connect positive end of the LED diode to the pin 3 of the relay and negative end to a 100 ohm resistor. Ground the other end of the resistor. Negative end of the diode will be the shorter wire.
2. Apply 3 V to pin 1
3. Turn LED on/off by switching the relay. Explain your results in the video. Draw the circuit schematic

Figure 11: Video explaining results and operation of the relay/LED circuit.

Figure 12: Circuit Schematic
Operational Amplifier (data sheet under Bb/week 6)
1. Connect the power supplies to the op-amp (+10V and 0V). Show the operation of LM 124 operational amplifier in DC mode with a non-inverting amplifier configuration. Choose any opamp in the IC. Method: Use several R1 and R2 configurations and change your input voltage (voltages between 0 and 10V) and record your output voltage. (EXPLAIN with a TABLE)

Figure 13: Table of Measured V_out. The gain is dependent on the ratio of R2/R1. As you can see with the measurements of R2=2K, the gain is high enough for the V_out to reach maximum voltage near immediately, whereas the other has a bit of an incline before it reaches max.
Post Blog Note:
All questions near end of blog sheet were not able to be complete, as there was not a temperature sensor available to this group. (Questions 2,3, 4: Operational Amplifier)
i have one comment in your blog that don't forget to write the explanation for the videos. the answers for the rest of the questions seems good to me we get the same graphs for all first questions
ReplyDeleteBlog looks fine. Maybe just change were the graphs are in relation to the text. It is kind of bizarre seeing it wrapped around the graphs. Might be best to just put the explanation after.
ReplyDeleteWe have the same looking graphs. Just a suggestion, maybe change some of the spacing or colors tone of the font to help distinguish what goes with what. There are some parts that I was pretty confused about until i actually read it fully. Finish up and do a few touch ups and you'll be set.
ReplyDeleteFor Question 1 (first one), I thought it was interesting that we have the exact same measurements for the maximum value for each of the graphs, however our minimums are off by so much considering the accuracy of the first two, not sure if we ended making a slight measuring error or what
ReplyDeleteI found it interesting how consistent your Vout values for 1 were. Also that your Vout values weren't that close to what you'd think they would be considering the gain you established with the resistors. For number 1 our values varied a little at first then reached a consistent output and for number 2 our values were a lot closer to what we though they'd be considering the gain. Do you have any ideas why this might be?
ReplyDeleteYour numbers for #1 were VERY close to ours. We didn't measure that close to zero when we did the non-inv. amplifier so our graph looks bad, but I also like the way you did your videos too. Did you have a problem with the relay when you first started using it? We did because we had to flip it over to look at it.
ReplyDeleteYou guys did a really good job this week. The blog is very clear to read and very well organized. The data you got for #1,#2 and #3 was really similar to what we acquired. The videos are very clear to understand which helps us have a better understanding of whats going on. Remember to caption the table and graph under question #3 and you should be good.
ReplyDeleteWhat is happening within the relay that turns the LED on and off with the changes in voltage and how does this relate to the measured resistance values from the different voltages in the relay from the earlier question?
ReplyDeleteYour values for number 1 seem to be close to what we got, only reversed. I think we made a mistake and placed our graphs in the wrong location. What do you think caused the difference between calculated and measured results in number 2? Your circuit diagram drawing was very neat and easy to read. Your videos had good detail and were easy to understand.
ReplyDeleteWe had similar values for our Vout for the operational Amplifier Data table, (which by the way needs the title to be bolded). Good job on your measurements, you guys sure took a lot of them for those tables and plots. There are some typos and minor formatting errors, great videos explaining the relay (I wish ours wasn't broken) I'm definitely going to use these in the future.
ReplyDeleteVery easy to read, informative blog. My only suggestion would be: for question 1, it is worth mentioning that at Vin=0, Vout is nearly a vertical line (unless you zoomed in a lot). This is due to the very high gain of an open loop op amp.
ReplyDeleteVery similar results comparing to ours. I like how you did take a lot of measurement as we did. Nice and clear explanations in the the questions and videos. It make more sense to me now why we got wrong graph for question number 2 and 3 after looking at your blog. Well done.
ReplyDeleteNo responses to comments. Otherwise, good blog.
ReplyDeleteGoing off what Joe and Justin said have you thought about why your graph for number 2 differs from your theoretical graph? Specifically, at the boundaries our graph approached values closer to how theoretical maximum and minimum and in addition our maximum and minimum values had the same absolute value.
ReplyDelete