Tuesday, April 18, 2017

Blog 13: Nicholas Miller

NOT SHOCKING PEOPLE AFTER THEY'VE NOT SHOCKED THEMSELVES


Week 13 Rube Goldberg: Nicholas Miller

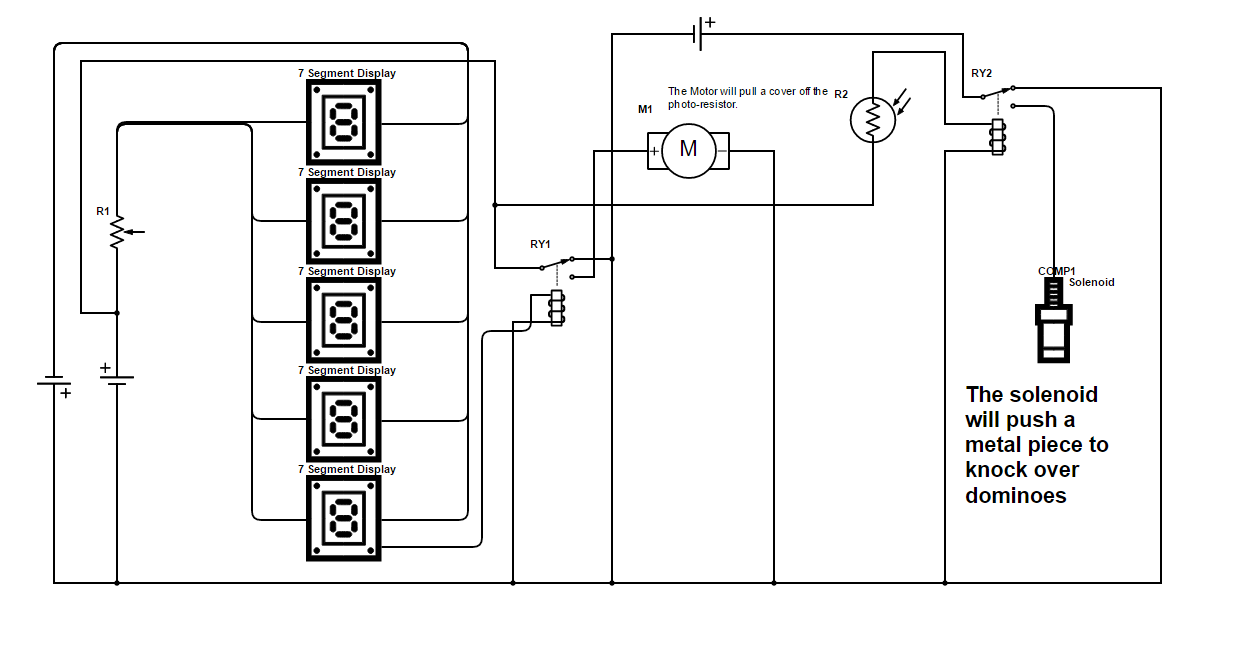
Updated Schematic of Rube Goldberg


Figure 1: Circuit Schematic

Explanation of Circuit:

So what till happen is a trail of dominoes knocked over by Abdhullah's RB will knock over a domino into a shoot which will then land on an FSR. this will allow the 555 timer to begin pulsing which will make the counter begin to send signal to the driver which will begin to count up from 0 on a 7 segment display. When the display reads 4, the XOR gate the counter is connected to will activate and send current to an opamp which will amplify the voltage to activate another set of 7 segment displays which will display B I L I M (the Turkish word for 'science'). 
While this is happening, dominoes will still be falling toward the switch which is being pressed down, until the dominoes in motion knock over the pressing mechanism which will allow voltage to reach the motor from the voltage going to the set of 7 segment displays.

POST MOTOR: The idea is that the motor will either knock over more dominoes or will push a ball towards the next circuit. (More discussion is needed ;D )

More Circuit Images

Figure 2: Force Sensing Resistor Placement
Figure 3: FSR connection to 555 Timer--> Counter--->XOR
Figure 4: Connections of 555 timer, driver, counter, and 7 segment display
Figure 5: Showcasing connection between XOR gate and OP-AMP
Figure 6: Connections to 7 segment displays that read B I L I M (Science in Turkish)
Figure 7: Domino cradle to rest on switch
Figure 8: Motor Placement
Figure 9: Full Circuit and Mechanical w/out dominoes
Figure 10: Full Circuit and Mechanical with dominoes 
Figure 11: Showcasing domino rested above its shoot to land of FSR 
Figure 12: Image of staircase domino setup for delivering domino forces to circuit (and for the hellz of a cool looking shot... kinda)

Videos of Test

Test 1: Success


Test 2: Success


Test 3: Failure


Explanations of Failures


Monday, April 17, 2017

Blog 13, Group GR

6. Group task: Explain your group RG setup.
first is Abdullah's circuit. and Op Amp connected to force sensing resistor, heavy height will connect the Op Amp to gives power to start a motor. The motor will pull dominos to pull a bottle that connected pull a wire out in the second circuit to connect the relay to power the display "by connected 555timer, counter and 7447" to count from 0 to 9. Then the motor will start and pull Corkboard to fall down and the corkboard connects Nich circuit by a thread. 

7. Group task: Video of a test run of your group RG.

Blog 13 Abdullah Alramadhan

1. Provide the updated computer drawing for your individual RG setup.
fig. 1&2: RG circuit setup
2. Explain your setup.
In my Rube Goldberg set up I have an Op Amp connected to the force sensing resistor, The Op Amp gives power to the FSR force which connects power to start a motor. The motor will pull dominos to pull a bottle that connected to a wire in the second circuit after the relay - this wire shorted the second circuit-.in the second circuit when the wire removed be the thread the powered Relay. then from the relay to 555 timers to counter which connected to 7447 to display. The display will count from 0 to 9 then the motor will start and pull Corkboard
3. Provide photos of the circuit and setup.
fig. 3,4,5 and 6: parts of the GR circuits
4. Provide at least 2 new videos of your setup in action, one being a failed attempt.
fig. 7&8: videos for GR circuits
5. What failures did you have? How did you overcome them?
1. how to connect relay, 555timer, counter and 7447. it took a long time and too many wires to connect them all together. I tried to get help from our old blogs and finally they worked.
2. how to connect the motor after display. I think I have to use "OR or XOR gate". I don't solve this problem until now.

Monday, April 10, 2017

Blog 12 Abdullah Alramadhan

1. Provide the computer drawing for your individual RG setup.


fig. 1&2: RG circuit setup
2. Explain your setup.

In my Rube Goldberg set up I have the force sensing resistor connected to an Op Amp, when we give the FSR force the Op Amp the connect with the power and it will start a motor. The motor will pull weight to another FSR in the second circuit to connect the Relay. The Relay will start display to give number 9 “out group number”, also it will start motor to pull 
Corkboard.  
3. Provide photos of the circuit and setup. 

fig.3: the whole circuit
fig. 4 Relay part circuit
fig. 5: Op Amp circuit

4. Provide at least 2 videos of your setup in action (parts or whole), at least one being a failed attempt.

fig. 6&7: Circuits videos 


5. What failures did you have? How did you overcome them?

a- I had a failure with the Relay, its output wasn’t accurate and it could it start the motor. At the end, we found that the Relay wasn’t working. Everything goes well when we changed it.

b- The biggest failure I had that when I connect FSR to start Rely, the voltage dropped. I think I should some resistors or something else that can make the voltage and current constant. Until now I don’t solve this problem.

Blog 12 Nicholas Miller


Monday, March 27, 2017

Week Eleven

Week Eleven

Not Shocking People While Generating eNeRgY

Part 1: Strain Gauges:

Problem 1:
Figure 1: Minimum and Maximum Voltages measured (Volts)

Figure 2: Low intensity flipping observation
Figure 3: High Intensity Flipping Observation

Figure 4: Low intensity tapping observation

Figure 5: High Intensity Tapping Observatinon

Problem 2:
Figure 6: Single Sequence tapping output 

Figure 7: Single Sequence Flipping output


Part B:
Problem 1:


 Figure 8: Rectifier Circuit Setup
Figure 9: Signal Output Snapshot
Problem 2:

Figure 10: Calculated V_rms. Measured values are the same, just not recorded onto table.

Problem 3:
We calculated the RMS values by taking the peak values taken by the oscilloscope and divided the value bu sqrt(2). The measured and calculated values match.
Problem 4:
Figure 11: Output Voltages of rectifier in parallel with 1 micro Farad Capacitor

Problem 5: 
Figure 12: Output voltages of rectifier in parallel with 100 micro Farad Capacitor

The peak to peak voltage output is much lower, but the mean output is higher.

Part C: Energy Harvesters

Problem 1:
Figure 13: Final output voltage at duration end using the tapping energy harvester.

Figure 14: Final output voltage at duration end using the flipping strain gauge energy harvester.

Problem 2: With the tapping energy harvester, it seemed that with the initial tap, there was the highest amount of energy. At the start of every test, the energy read about or above 200 mV, however, as time went on and the test continued, the output went down. This is because the more we tapped out harvester, the faster the capacitor was filled which was decreasing the flow change in voltage through the capacitor. 

With the flipping energy harvester was used, the more and longer we flipped the harvester over time the greater the amount of voltage that dropped through the capacitor.

Problem 3: There would be a back-flow of energy due to there not being a diode, which would make the output have negative troughs as well as positive peaks.

Problem 4: 

close all;
clear all;
t = [125 80 0]; %1 Tap/sec
y = [71 91 0]; %4 tap/sec
f = [17 19 71]; %1 flip/sec
g = [105 205 220]; %4 flip/sec
d = [10 20 30];

plot(d,t,'r')
hold on
plot(d,y,':r')
hold on
plot(d,f,'b')
hold on
plot(d,g,':b')

xlabel('Seconds(s)')
ylabel('Output Voltage(mV)')
legend('1 Tap/Second','4 Tap/Second','1 Flip/Second','4 Flip/Second')

Figure 15: Plotted information from Figures 13 and 14.

Monday, March 20, 2017

Week Ten

Not Shocking People Whilst Using MATLAB

Week Ten

%1 
clear all;
close all;
x = [1 2 3 4 5];
y = 2.^x;
plot(x, y, 'LineWidth', 6)
xlabel('Numbers', 'FontSize', 12)
ylabel('Results', 'FontSize', 12)

clear all; %2 clear all removes prior variable and function definitions

close all; %3 closes any prior command based windows (i.e. plot, ext.)

x = [1 2 3 4 5]; 

y = 2.^x;

plot(x, y, 'LineWidth', 6)

xlabel('Numbers', 'FontSize', 12)

ylabel('Results', 'FontSize', 12)

%4 when typing x and pressing enter, the prior logged values for x appear
%the matrix has one row and five colomns.

%5 the semicolon is used when defining the function, which without it, would
%the values would not be stored and the plot function nor defined

%6 If a . is not used before the power, the x values will be read as a whole
%matrix instead of being recognized individually.

%7 It affects the thickness of the line that is plotted

%8
clear all; 
close all; 
x = [1 2 3 4 5];

y = 2.^x;

plot(x, y, '-rO','LineWidth', 5,'markersize',18)

xlabel('Numbers', 'FontSize', 12)

ylabel('Results', 'FontSize', 12)


%9
clear all; 
close all; 
x = [1; 2; 3; 4; 5;];

y = 2.^x;

plot(x, y, '-rO','LineWidth', 5, 'markersize',18)

xlabel('Numbers', 'FontSize', 12)

ylabel('Results', 'FontSize', 12)


%The plot stays the same, as these colons are already expressed when the .
%is placed before the ^

%10
clear all; 
close all; 
x = [1 2 3 4 5];

y = 2.^x;

plot(x, y, ':ks','LineWidth', 6, 'markersize',14)
grid on
xlabel('Numbers', 'FontSize', 12)

ylabel('Results', 'FontSize', 12)


%11
%a : on google calculator
%sin(30)=0.5

%b
%sin(30) = -0.9880
%They are differenct because google automatically calculates sin using
%degree values inside the parenthesis, whereas when in MATLAB, sin(x) is a
%radian command, while sind(x) is using degrees

%c
%sind(30) = 0.5000

%12
clear all;
close all;
t = linspace(0,0.12,10);
y = 10*sin(100*t);
u = linspace(0,0.12,1000);
z = 10*sin(100*u);

plot(t,y,'-ro')
hold on
plot(u,z,'-k')

xlabel('Time(s)')
ylabel('y function')
legend('Course','Fine')


%13 
%Differences: Two plots were formatted atop one another using the hold on
%command, the variables were defined using intervals of range of values,
%there was a legend added.

%14
clear all;
close all;
t = linspace(0,0.12,10);
y = 10*sin(100*t);
u = linspace(0,0.12,1000);
z = 10*sin(100*u);
f=find(z>5)
z(f)=5
plot(t,y,'-ro')
hold on
plot(u,z,'-k')

xlabel('Time(s)')
ylabel('y function')
legend('Course','Fine')


PART B
1.

2.
%PART B
%2

clear all;
close all;
f=[.1 .2 .3 .4 .5 .6 .7 .8 .9 1 1.1 1.2 1.3 1.4 1.5 1.6 1.7 1.8 1.9 2]
v=[3.25 3.82 3.66 3.58 3.5 3.4 3.3 3.2 3.07 2.96 2.85 2.75 2.63 2.53 2.45 2.35 2.28 2.2 2.12 2.05]

plot(f,v,'-ro')

xlabel('frequency(KHz)')
ylabel('V out(V)')
grid on


3.
fc= 1/(2*3.141593*7500*0.000000022)
fc =

  964.5753

%The voltage at 965 is 3

clear all;
close all;
f=[.1 .2 .3 .4 .5 .6 .7 .8 .9 1 1.1 1.2 1.3 1.4 1.5 1.6 1.7 1.8 1.9 2];
v=[3.25 3.82 3.66 3.58 3.5 3.4 3.3 3.2 3.07 2.96 2.85 2.75 2.63 2.53 2.45 2.35 2.28 2.2 2.12 2.05];
c=find(v>3)
v(c)=3
plot(f,v,'-ro')

xlabel('frequency(KHz)')
ylabel('V out(V)')
grid on


%4
clear all;
close all;
f=[.1 .2 .3 .4 .5 .6 .7 .8 .9 1 1.1 1.2 1.3 1.4 1.5 1.6 1.7 1.8 1.9 2];
v=[3.25 3.82 3.66 3.58 3.5 3.4 3.3 3.2 3.07 2.96 2.85 2.75 2.63 2.53 2.45 2.35 2.28 2.2 2.12 2.05];
c=find(v>3)
v(c)=3
plot(f,v,'-ro')
hold on
y=[.1 .2 .3 .4 .5 .6 .7 .8 .9 1 1.1 1.2 1.3 1.4 1.5 1.6 1.7 1.8 1.9 2];
u=[3.25 3.82 3.66 3.58 3.5 3.4 3.3 3.2 3.07 2.96 2.85 2.75 2.63 2.53 2.45 2.35 2.28 2.2 2.12 2.05];
plot(y,u,'--k')
legend('output with cutoff','output')

xlabel('frequency(KHz)')
ylabel('V out(V)')
grid on
%5
%1 & 3


%2
clc;
clear all;
close all;
f=[.1 .2 .3 .4 .5 .6 .7 .8 .9 1 1.1 1.2 1.3 1.4 1.5 1.6 1.7 1.8 1.9 2]
v=[3.25 3.82 3.66 3.58 3.5 3.4 3.3 3.2 3.07 2.96 2.85 2.75 2.63 2.53 2.45 2.35 2.28 2.2 2.12 2.05]

plot(f,v,'-ro')

xlabel('frequency(KHz)')
ylabel('V out(V)')