Week 4
Not Shocking People
1. (Table and graph) Use the transistor by itself. The goal is to create the graph for IC (y axis) versus VBE (x axis). Connect base and collector. DO NOT EXCEED 1 V for VBE. Make sure you have the required voltage value set before applying it to the base. Transistor might get really hot. Do not TOUCH THE TRANSISTOR! Make sure to get enough data points to graph. (Suggestion: measure for VBE = 0V, 0.5V, and 1V and fill the gaps if necessary by taking extra measurements).
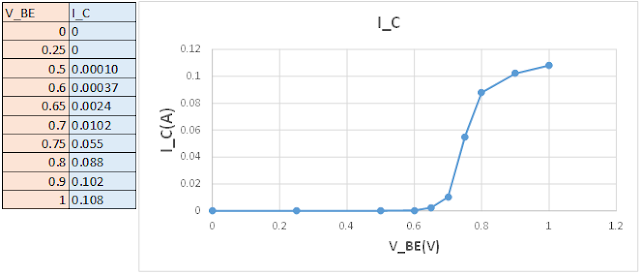 Figure 1& 2: Corresponding between the table and the line graph, is the measurements of V_BE(V) and I_C(A). As can be seen, as the Voltage of V_BE is increased little occurs till 0.6V, wherein which the current of I_C is allowed to begin to flow, and later plateaus at max current.

2. (Table and graph) Create the graph for IC (y axis) versus VCE (x axis). Vary VCE from 0 V to 5 V. Do this measurement for 3 different VBE values: 0V, 0.7V, and 0.8V.

Figure 3 & 4: The corresponding images of the table and graph show the measurements of the current I_C(A) while each separate voltage V_BE(V) is applied. It is shown that as the voltage is increased (V_BE), more current is allowed to flow. As for V_CE, as it is increased, more current is pushed through due to the magnitude of the Voltage.
3. (Table) Apply the following bias voltages and fill out the table. How is IC and IB related? Does your data support your theory?

Figure 5: The measurements of current through I_C and I_B while increasing voltage through V_BE(V)
I_C and I_B are related in the sense where after a certain voltage is applied at V_BE(V), the current through I_B will be able to flow to a significant degree, and the current from the collector will be able to flow at significant quantities, as you can see as the voltage is increased at V_BE the current at I_B increases to a significant degree of mA's and I_C is current is increased significantly.
4. (Table) Explain photocell outputs with different light settings. Create a table for the light conditions and photocell resistance.
The more light that is applied to the photoresistor, the less resistance it produces. For example, with light in a typical florescent classroom, the current is measured highest at 3.8mA. As less light (photons) are allowed to enter the photoresistor, the more resistance is applied, forcing the current to be lower and lower. \

Figure 6: Current and Resistance Measurements of the photoresistor as less and less light is applied.
5. (Table) Apply voltage (0 to 5 V with 1 V steps) to DC motor directly and measure the current using the DMM.

Figure 7: Measured Current through a DC motor
6. Apply 2 V to the DC motor and measure the current. Repeat this by increasing the load on the DC motor. Slightly pinching the shaft would do the trick.

Figure 8: Current measured whilst pressure is added to the motor (Nick pinching).
7. (Video) Create the circuit below (same circuit from week 1). Explain the operation in detail.
Figure 9: Video explaining the operation of the circuit supplied.
8. Explain R4’s role by changing its value to a smaller and bigger resistors and observing the voltage and the current at the collector of the transistor.
The purpose for R4 is to dictate the voltage that goes through the transistor. If there was too small or no resistor at R4, the current entering the transistor would be too high and could short the transistor. If the resistance is too high, then the current would not sufficiently flow to the Motor to make it run.
The circuit being displayed is one that would have made this function properly work if we had transistors and photoresistors that could handle a higher voltage needed to make the 12V DC Motor run. The circuit setup is directly similar to that of the previous problem (#7). However, not enough current could be moved through the transistor to make the motor run. This could be solved by getting a stronger power source and transistor, or to use relays.
9. (Video) Create your own Rube Goldberg setup.
Figure 10: Video of initial Rube Goldberg setup.
There needs to be some lines in between questions at the top still. Questions 1, 2, 5, 6 should have some text to explain whats going on in the table and graphs. The extra explanation really adds a lot.
ReplyDeleteThank you. We will add one.
DeleteI like how you guys included tables along side your required graphs and how you guys used colors in your tables so they don't look plain. I also like your Rube Goldberg project it looks really cool. I can't wait to see the rest of it as the semester goes on!
ReplyDeleteThank you Mary
DeleteI really like the idea of your Rube Goldberg project, it was awesome. From what I see, your measurements look right.The colors and tables makes it easy to read the blog. However, I think you guys should work on the explanation of the questions in your blog. Question 1 and 2 don't have any explanation at all As well as question number 6. Other than that, I would say you did a great work
ReplyDeleteThank you Mohannad. We will add some explaination.
DeleteExcellent work on the Rube Goldberg machine. How did you come up with your photocell coverage and "pinch pressure" percentages?
ReplyDeleteWe figured the percentages based on inference on how much Nick was able to pinch it, as well as the amount of airspace above the device. It is not exact but we felt that it was a close axroximate and would get the point across.
DeleteGreat job with the blog Rube Goldberg machine was awesome and the graphs looks great, but #7 i would put in a written explanation as well to get your point across better.
ReplyDeleteThank you. We will add explaination.
DeleteGood RG.
ReplyDelete